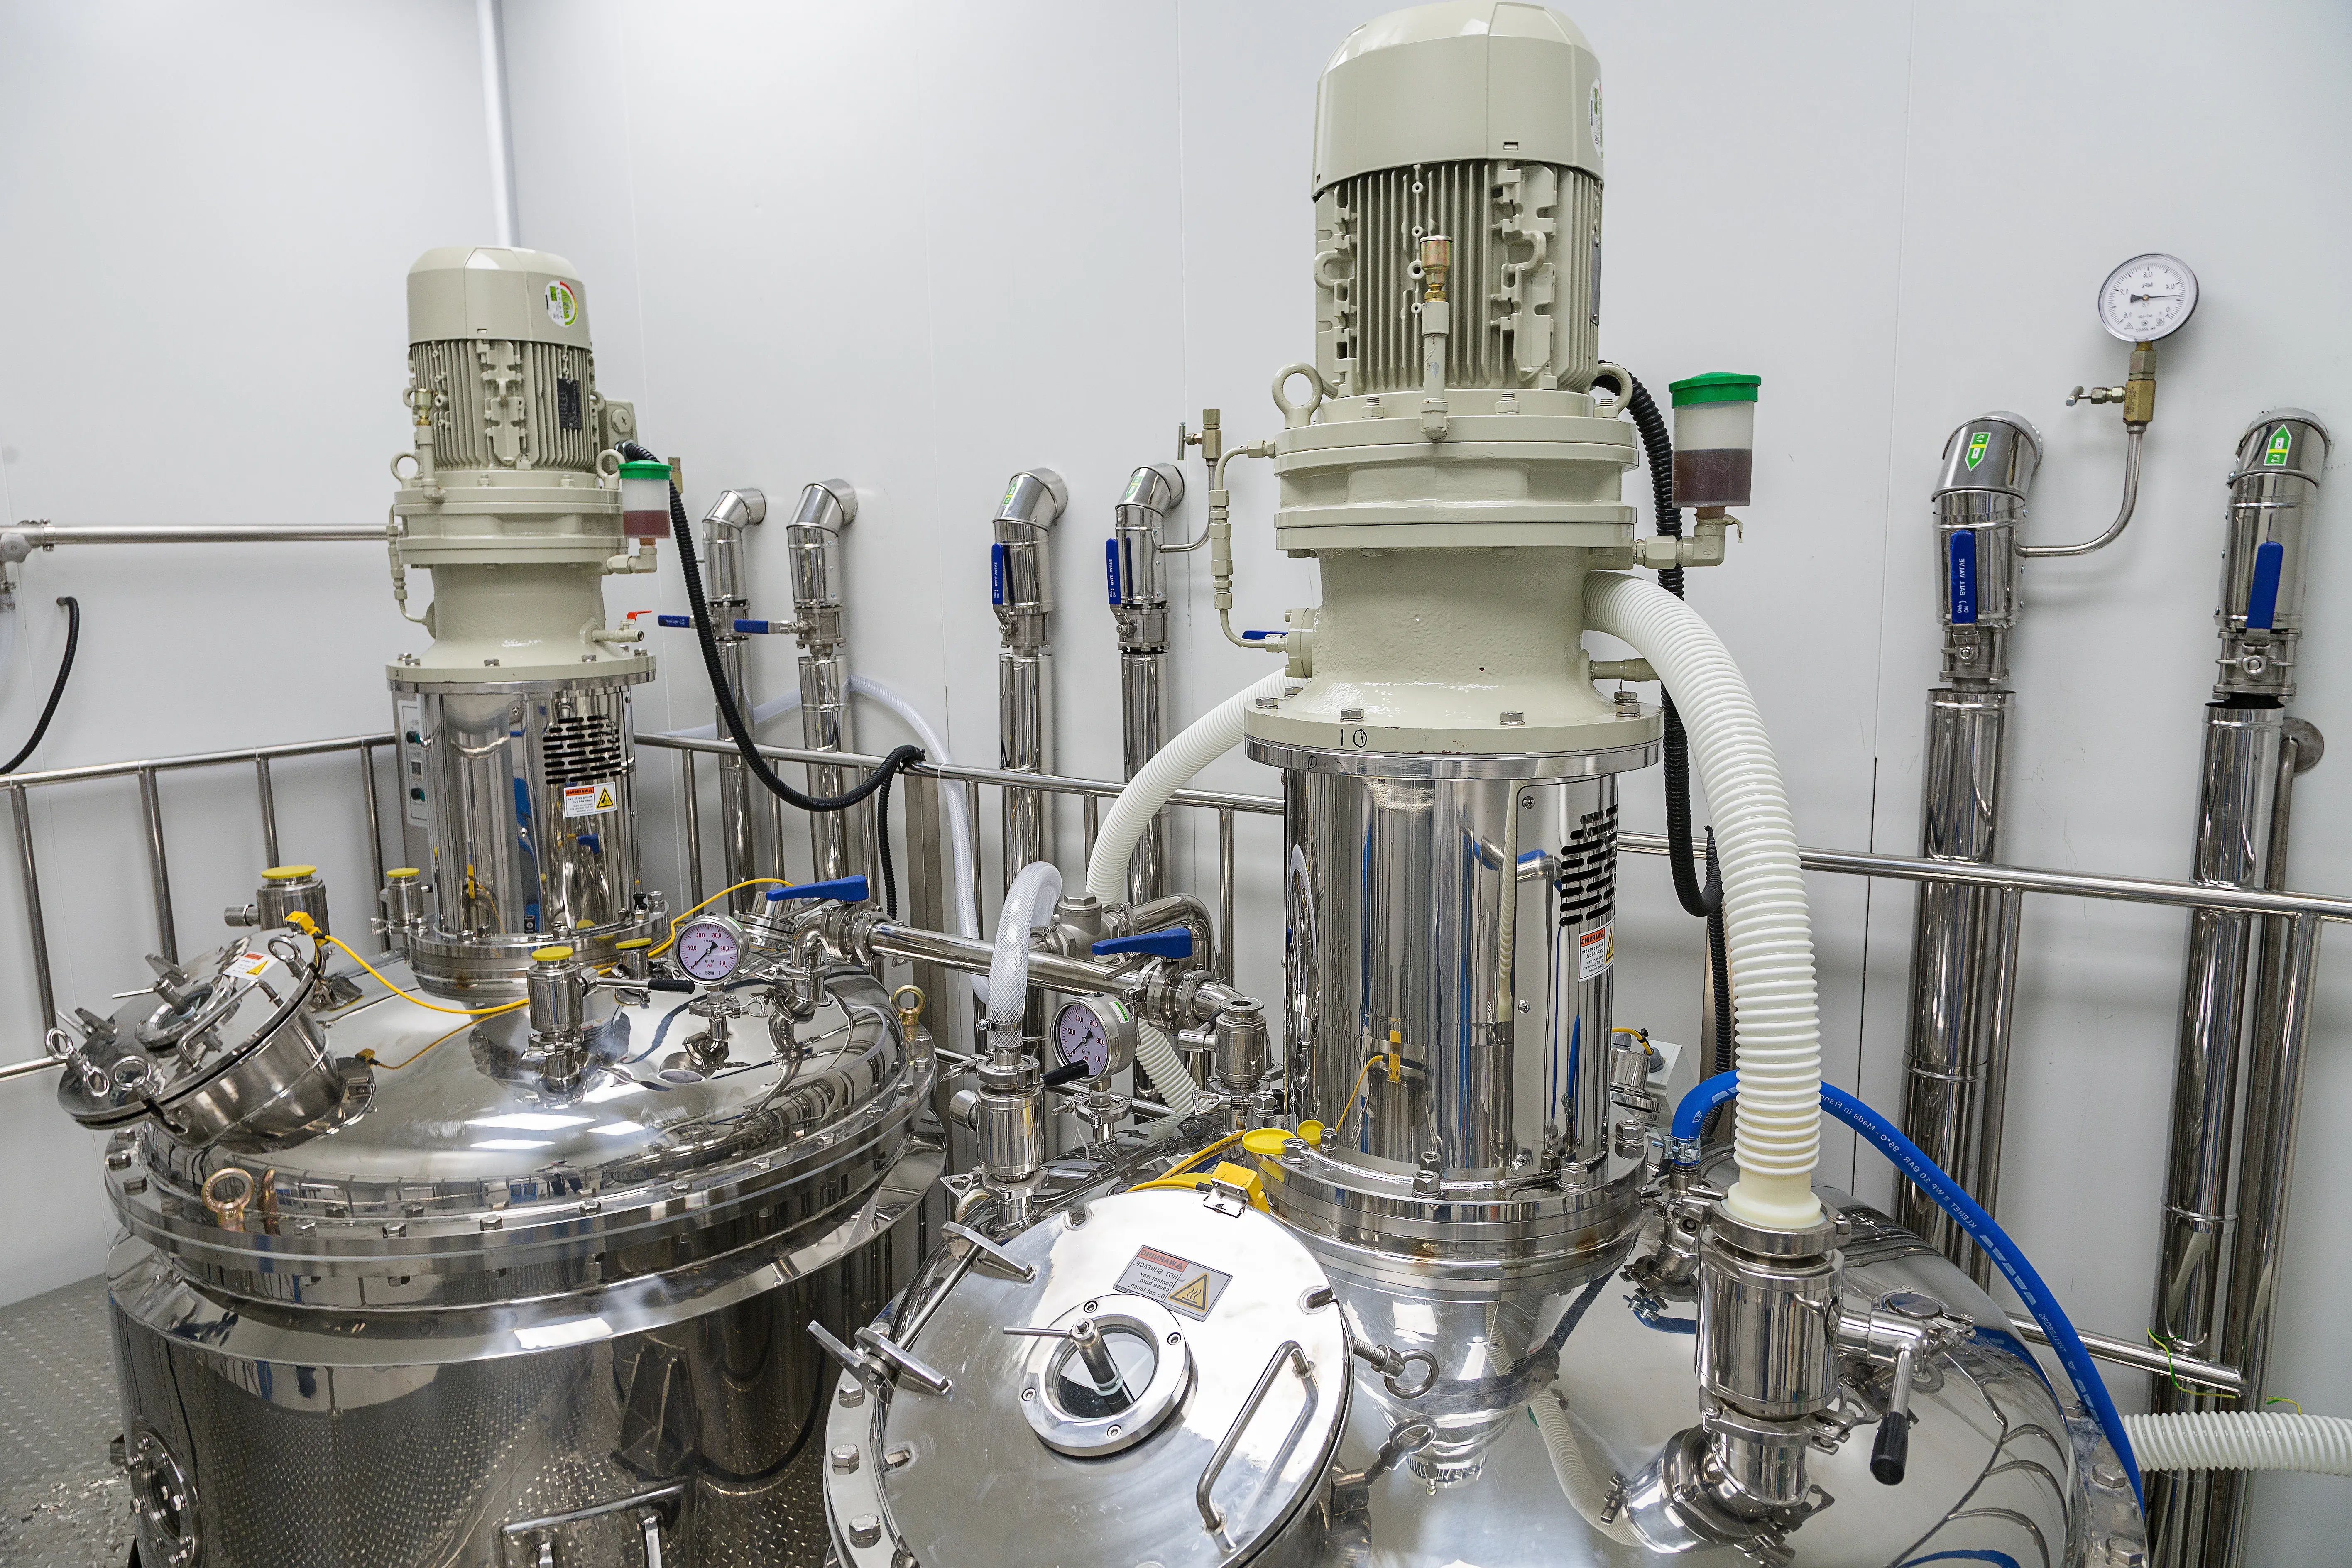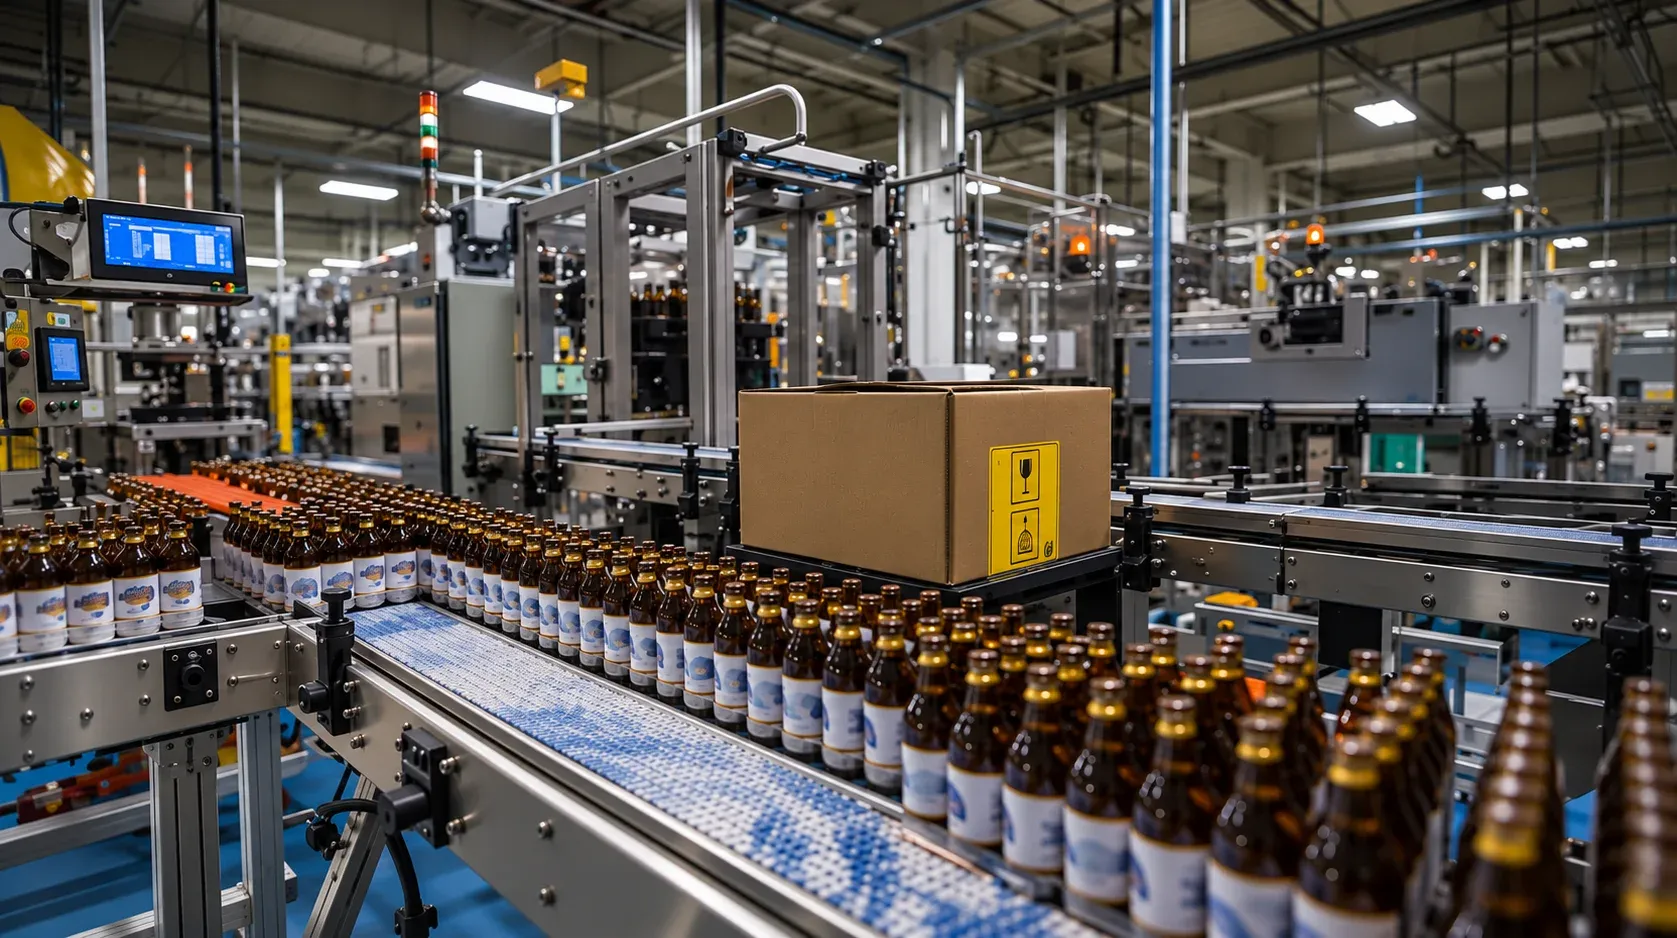
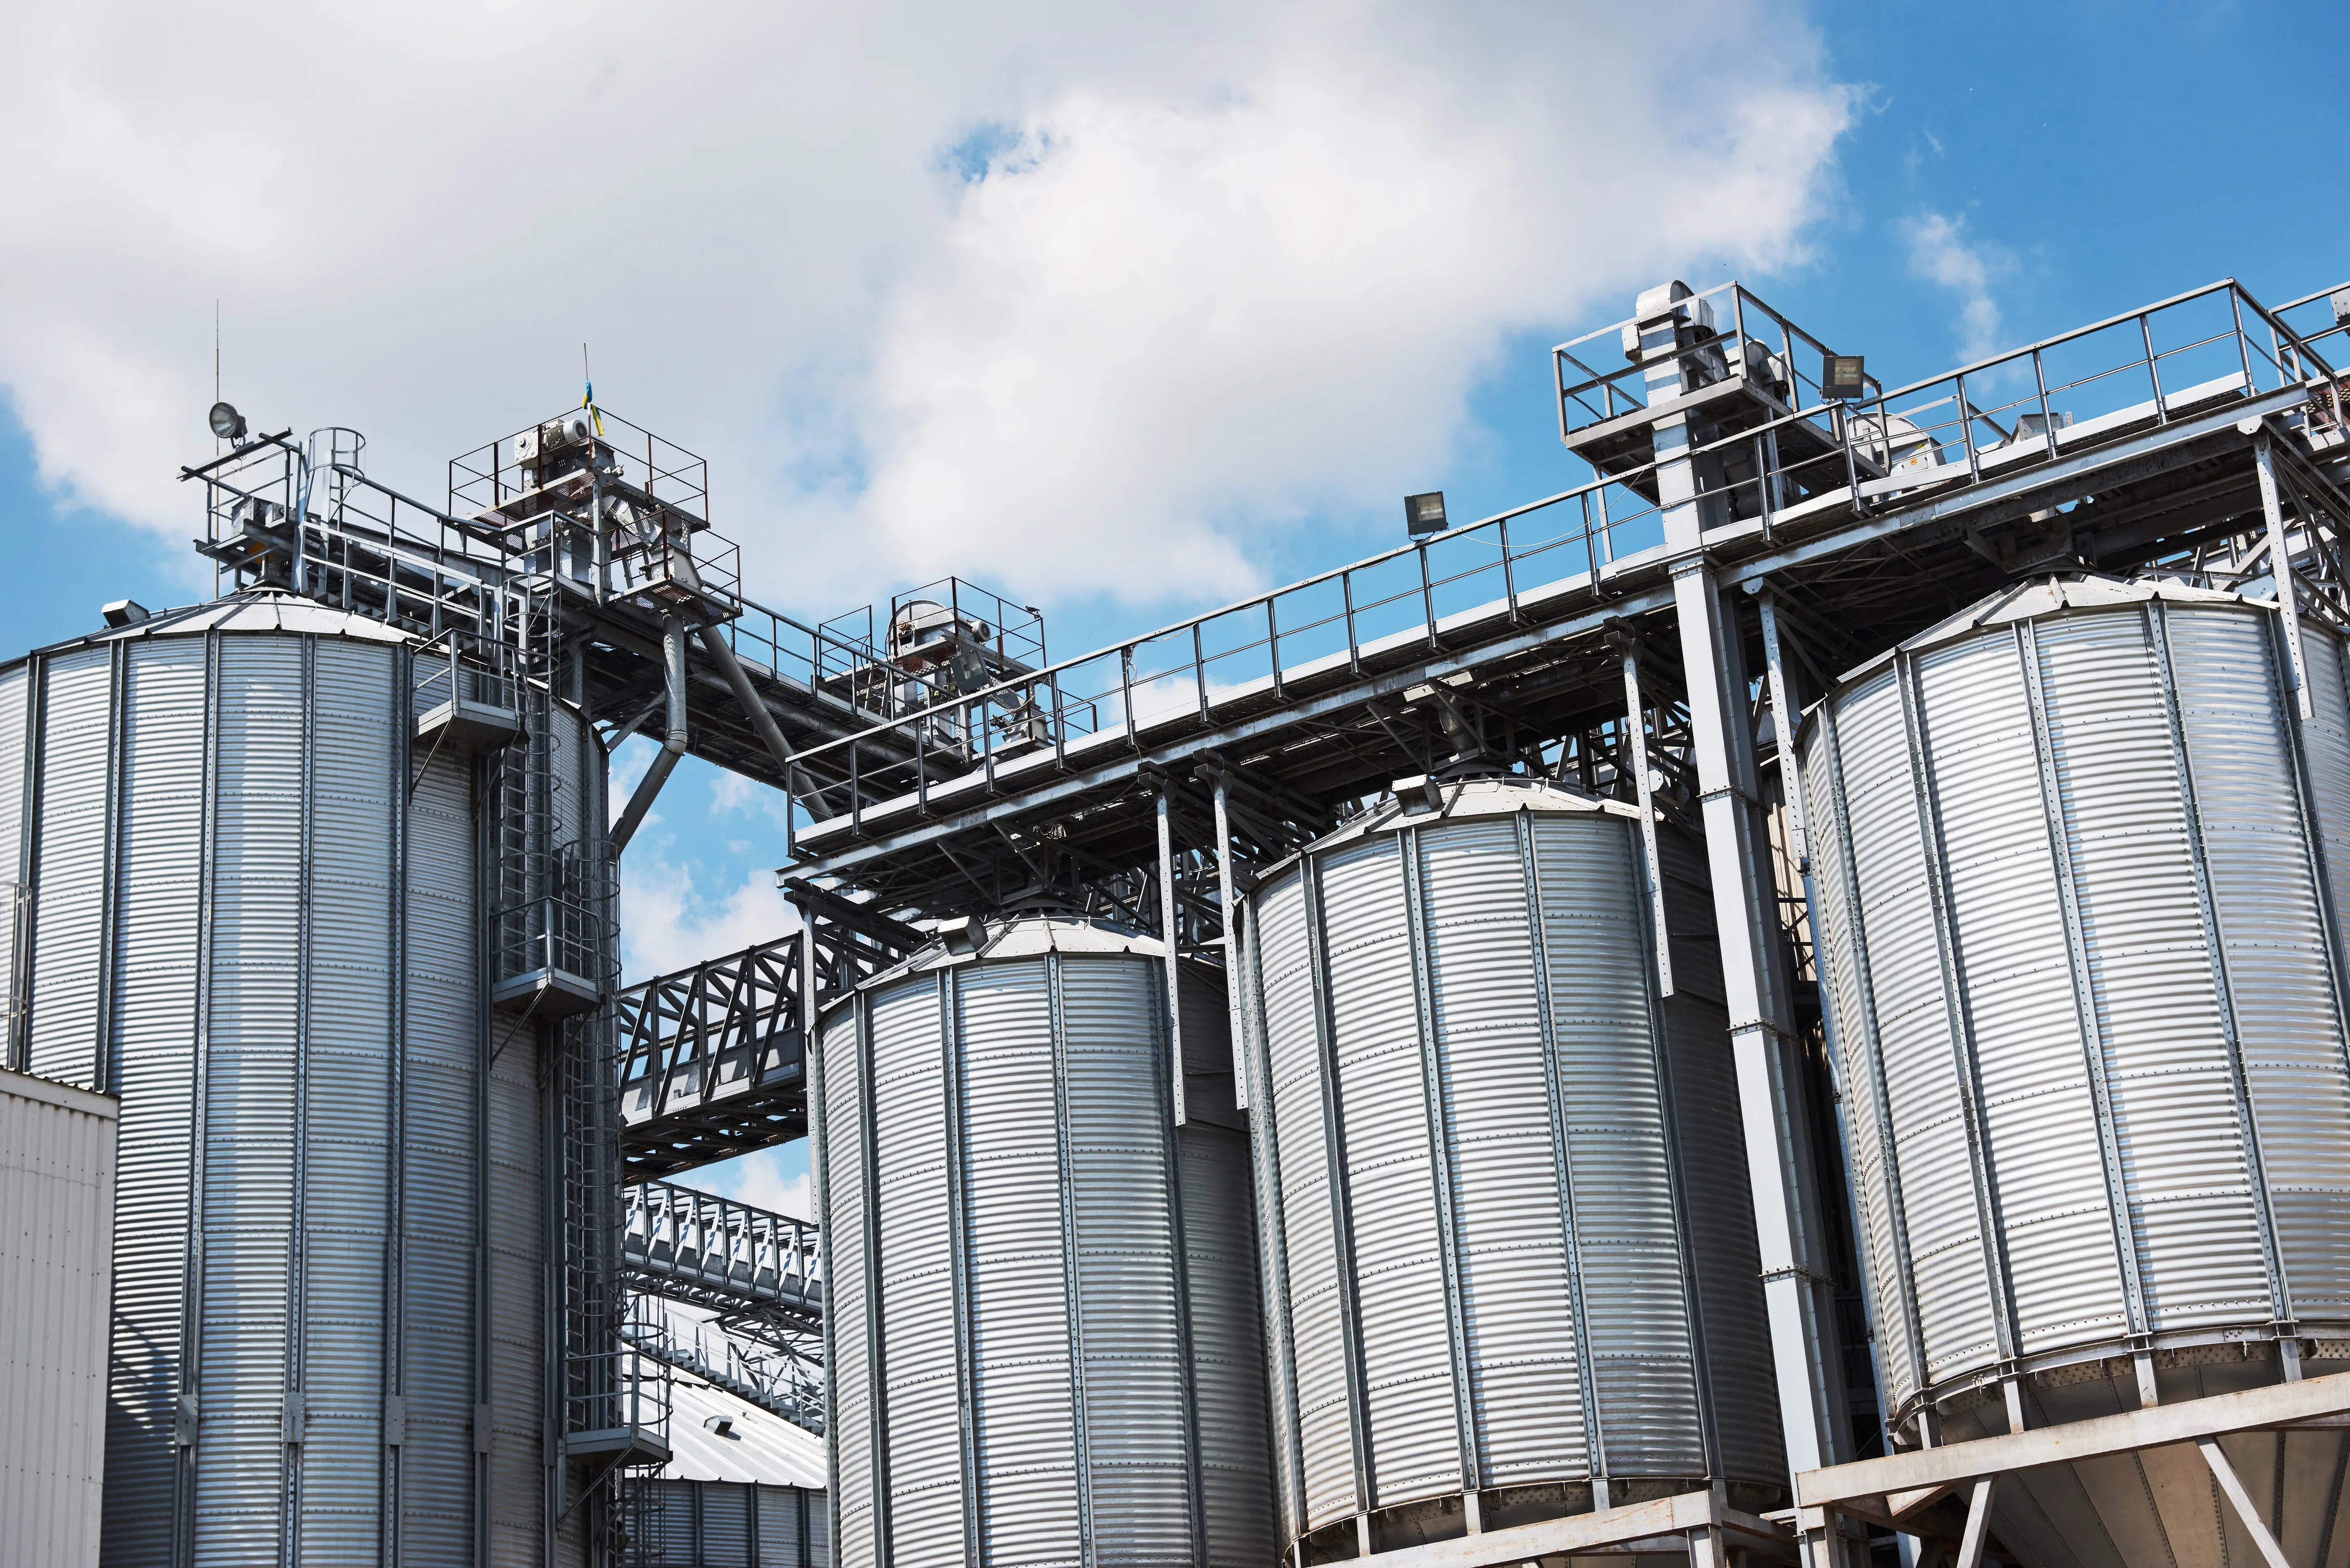
Picture two beverage manufacturing factories. Same filler, same blow molder, same labeller, bought from the same suppliers in the same year. One ships on time and protects its margins. The other is always chasing orders and explaining shortfalls in Monday meetings.
I’ve walked through plants like both, and the machines were never the difference. Beverage manufacturing rewards the plants that run well, not the ones that simply own good equipment. Here’s what really separates them.
Why Similar Beverage Manufacturing Equipment Doesn’t Guarantee Similar Production Results
A machine’s rated speed is a promise made under perfect conditions. Preforms arrive late, a changeover runs long, an operator waits on a forklift. Each delay is small. Together they decide whether a beverage production line hits 70% of its rated output or 90%.
That’s the paradox of beverage manufacturing. There can be two plants that have the same machines yet end up being poles apart due to the nature of the output that depends not on any particular machine but the entire process of producing the beverages. Just like two kitchens using the same stove one with the head chef having planned the evening and the other without it.
What then is it that creates the difference? Most often than not there are four main aspects to look at: the planning of work, line layout, training of people, and problem spotting.
The Role of Production Planning in Beverage Manufacturing Efficiency
Planning is the quiet lever. A beverage manufacturing plant that schedules by gut feel loses hours it never sees on a report.
Take changeovers. Moving from a 500 ml bottle to a 1.5 liter bottle means new molds, new settings and a cleaning step. Run those changes in a sensible order, light flavours before heavy ones and similar formats together, and you give back real production time. Run them in whatever order sales happens to shout, and the beverage production process lives in transition.
Inventory flow matters just as much in beverage manufacturing. When preforms, caps, labels or cartons run short, the fastest machine in the building simply waits. The best managers I know run their beverage manufacturing plant on a plain weekly rhythm: confirm materials, lock the schedule, protect it from last minute changes. It isn’t glamorous. It works, and it’s the cheapest manufacturing productivity gain on the floor.
How Equipment Configuration Impacts Beverage Production Line Performance
In beverage manufacturing, buying good machines is step one. Connecting them well is step two, and plenty of plants stall here.
A beverage production line behaves like a highway. If one stretch is narrow, everything behind it backs up.
Conveyor layout
Sharp turns, steep transitions and mismatched speeds make bottles tip and jam. Gentle paths keep containers upright and moving.
Accumulation table sizing
A table that’s too small can’t absorb a short stop at the labeller, so the filler stops too. Too large, and you waste floor space and scuff bottles. Size it to how long a typical recovery really takes.
Sensor synchronization
When sensors aren’t tuned, machines speed up and slow down out of step. That stop start rhythm quietly eats production line efficiency all day.
Good configuration lets any machine have a bad minute without dragging the whole beverage production line down.
Comparative Analysis: Underperforming vs. High Efficiency Beverage Plants
Here’s the side by side view of how production line efficiency shows up on the floor of a typical beverage manufacturing plant.
| Parameter | Underperforming Beverage Facilities | High Efficiency Beverage Plants |
|---|---|---|
| Operator Training & SOPs | Know how lives in a few veterans’ heads, and every shift runs a little differently | Written SOPs, cross training, and the same startup and changeover routine every shift |
| Preventive Maintenance vs. Reactive Repair | Fixes things after they break, then hunts for spare parts mid crisis | Scheduled inspections, wear parts swapped on a calendar, critical spares on the shelf |
| Accumulation Buffers & Micro Stop Management | Buffers undersized or ignored, short stops go unlogged | Buffers sized to the beverage production line, every stop logged and reviewed |
| Overall Equipment Effectiveness (OEE) | Often around 60%, leaving manufacturing productivity on the table | 85% is the commonly cited world class benchmark, tracked weekly |
The Importance of Automation and Technology in Beverage Manufacturing
Automation doesn’t replace good habits. It makes them visible.
"Real time" means you see what the line is doing today, not what was reported on the shift report yesterday. It will be known from the data when your capper starts to move into the stop state. Error proofing means that your machine will stop an issue from happening by rejecting labels or changes to the format that aren't correctly aligned.
Monitoring stops the finger pointing regarding how things are running during the beverage production process. The production manager thinks the maintenance manager is slow and vice versa. The data makes the case. In the beverage manufacturing industry, this consensus will be worth more than any number of upgrades. Start small, and use a couple well placed counters for good measure.
Key Factors Affecting Production Capacity, Downtime and Operational Efficiency
These profit killers rarely show up as one dramatic breakdown. They pile up in small pieces and quietly erode production line efficiency:
• Micro stops. A thirty second jam feels like nothing, but forty of them a shift is twenty minutes gone, every shift, every day
• Cleaning cycles scheduled mid run instead of at natural breaks in the beverage production process
• Operator error in beverage manufacturing, usually from unclear SOPs rather than careless people
• Reactive maintenance, where a worn part is replaced only after it stops the line
• Slow, guess based format changes with no standard settings
• Losses nobody measures, which means nobody fixes, and manufacturing productivity stays flat
Why Choose Seppa Solutions for Beverage Manufacturing Plant Solutions?
Seppa Solutions makes and supports industrial beverage processing and packaging equipment, so beverage manufacturing problems are familiar territory. Often a struggling beverage manufacturing plant doesn’t need new machines. It needs someone to look at how the current ones work together.
That’s where the work starts:
• Custom plant audits that measure real OEE, stop causes and bottlenecks across the beverage production process
• Optimized beverage production line layouts covering conveyors, buffers and sensor placement
• Operator training and maintenance programs built around your shifts
• Technical support for your beverage manufacturing plant when something goes sideways
The aim is simple: stronger production line efficiency and more manufacturing productivity from the equipment you already own, and a clear plan for when it’s time to add more.
Frequently Asked Questions About Beverage Manufacturing Efficiency
1. How do I calculate true OEE in beverage manufacturing?
Multiply availability, performance and quality. Availability is run time divided by planned time. Performance is actual output divided by output at rated speed. Quality is good bottles divided by total bottles. Count changeovers and micro 3stops as lost time, or the number will flatter your production line efficiency.
2. Why does my beverage production line keep having bottle jams?
Jams in beverage manufacturing usually follow a pattern. Start with the basics: worn guide rails, uneven conveyor speeds and rough transfers between machines. Then log where and when they happen before changing anything.
3. How should I train plant floor operators?
Write one page SOPs with photos, train on the actual line, and pair new hires with a strong operator. Consistent training is a cheap manufacturing productivity boost.
4. How do I manage multi format changeovers?
Group similar formats, stage parts and tools before the line stops, and mark settings so nobody guesses.
5. Which automation upgrades pay back fastest?
In beverage manufacturing, the cheap ones usually pay back first: line monitoring, sensors that catch jams early, and automatic format settings that lift manufacturing productivity.